What are the consequences of a continued increase in greenhouse gas emissions, and how much success could comprehensive reductions in emissions have in terms of mitigating these consequences? These questions can only be answered with the help of computer simulations of climate models. The Climate Scenarios CH2018 translate the complex scientific results of such climate models into comprehensible outlooks.
Important note
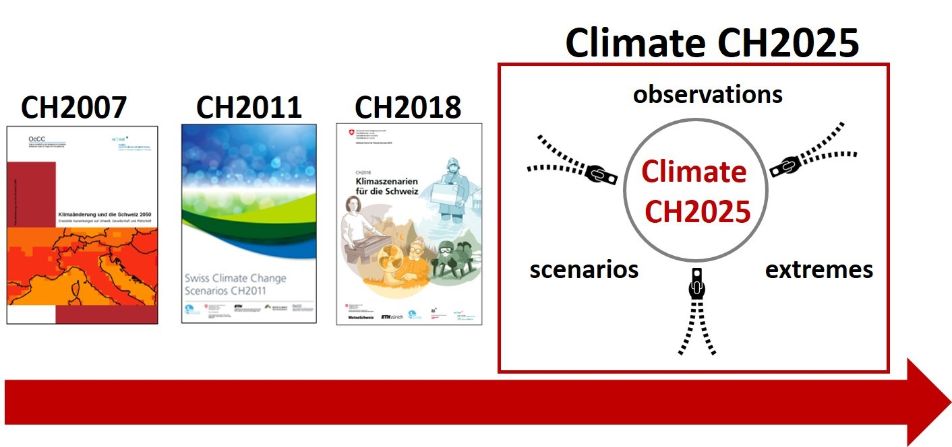
The content of this page is based on the Swiss climate scenarios CH2018. In the meantime, the new Swiss climate scenarios have been published as part of the Climate CH2025 project. They expand on the previous results with longer measurement series and information from new, high-resolution climate models. The qualitative statements remain unchanged from the CH2018 climate scenarios, but the quantitative estimates have changed. It is recommended that the results of Climate CH2025 be used.
What is behind the CH2018 Climate Change Scenarios?
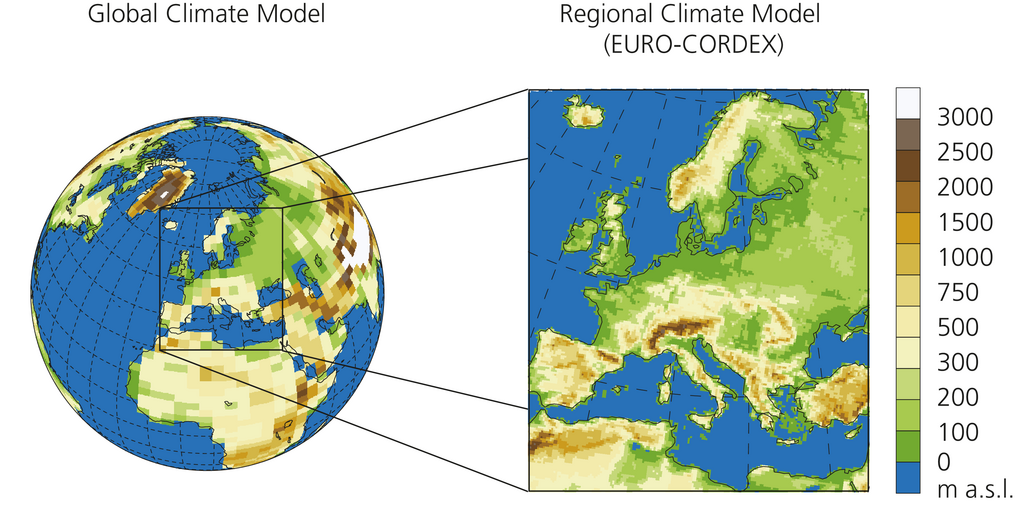
Simulations using a total of 21 different computer models run at European research institutions form the basis of the Climate Scenarios CH2018. The comparative analysis of several simulations allows the uncertainties associated with the Climate Scenarios to be estimated.
With the help of statistical methods, the resolution of the results can be further enhanced. Where long-term, reliable measurements exist, it is possible to draw conclusions about certain meteorological measuring stations or to produce extensive maps with a horizontal grid box size of two kilometres, as for instance for temperature and precipitation.
The simulated changes vary slightly from place to place. To arrive at a prediction of changes for Switzerland as a whole in each of the individual climate scenarios, the country was split into five regions, and the rounded median figures from these regions were analysed. Detailed information on the changes in these five CH2018 regions can be found in the Technical Report.
You will find detailed explanations of what Climate Change Scenarios are, how computer models work and why there are uncertainties, under Climate Basics.
Which emission scenarios are used?
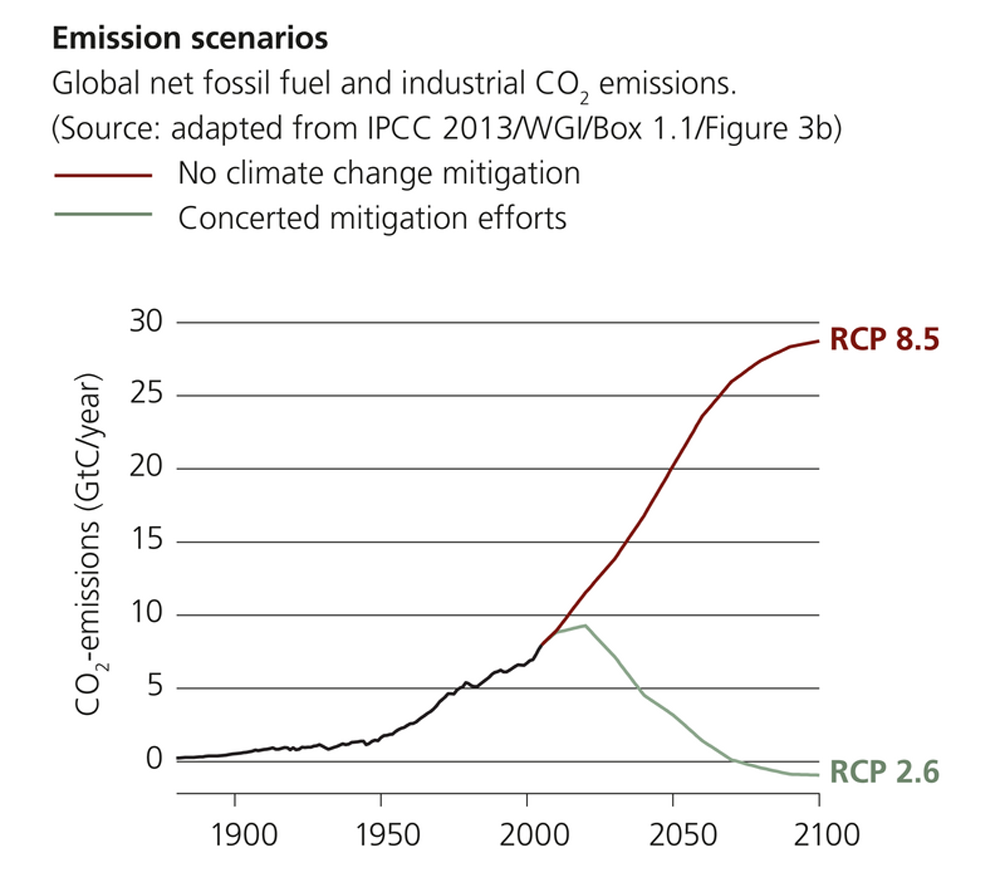
The primary cause of global climate change is the increase in greenhouse gas emissions by humans since industrialisation. The main agent is carbon dioxide (CO2), which is mainly formed by the burning of fossil fuels, but also through deforestation. Other gases also contribute, particularly methane, which forms in the process of fermentation – in swamps, in the stomachs of cows and in rice paddies. These gases accumulate in the Earth’s atmosphere and add to the natural greenhouse effect.
Whether and how quickly the concentration of greenhouse gases in the atmosphere will continue to rise depends on human behaviour. If all known climate change mitigation measures are fully exploited, it will be possible to reduce emissions of greenhouse gases quickly and sustainably. However, if no steps are taken, emissions will continue to rise unchecked.
The Climate Scenarios CH2018 illustrate the full range of possibilities in between these two extremes. In line with the work of the IPCC (Intergovernmental Panel on Climate Change), they take into consideration different possible development scenarios for future greenhouse gas emissions:
What time periods do the Climate Change Scenarios describe?
The Climate Scenarios CH2018 each describe an average level of climatic conditions over a period of three decades, grouped around the years 2035, 2060 and 2085.
The current “normal” period for the Swiss climate is the period from 1981 to 2010. These thirty years serve as the starting point for the simulations and as the reference period for all data on future changes in comparison to today’s climate. Notably, the climate has already changed since then, and the increase in temperature is happening more quickly than before 1980.
How are the results interpreted?
Simulations calculate how the climate would behave under the influence of rising or falling amounts of greenhouse gases. Because all models vary, they all produce slightly different results, even when the time period and influences being modelled are the same.
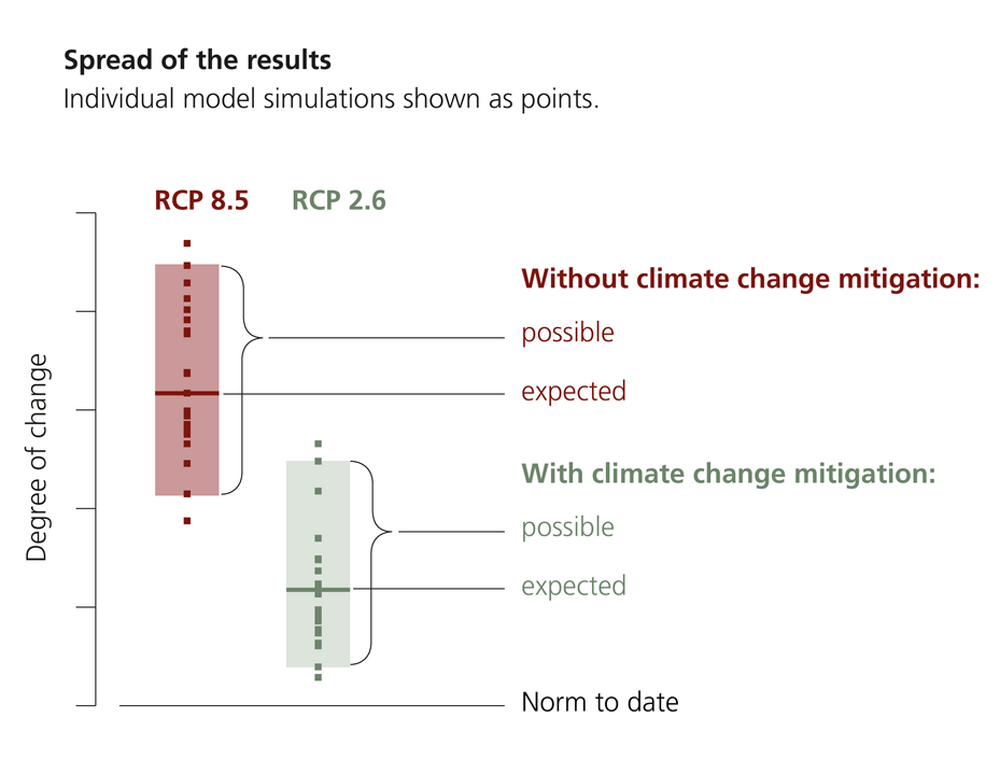
The projections of the climate models are always distributed within a certain range. Half the values sit above the so-called “median”, and half below. The median is thus the most plausible value and is described as the “expected” outcome in the Climate Scenarios (dark line in the graph).
The second highest result of the climate models is shown by the upper limit of the displayed range, and the second lowest by the lower limit. Consequently, the result is not merely informed by the most extreme values. All values in between the upper and lower limits of the range are described in terms of the Climate Scenarios CH2018 as “possible” (coloured bars in the graph). The probability of actual values lying within the “possible” range is estimated to be twothirds.
Of course, certain years in the future will deviate from the expected average values – as is the case now, where we see individual climate phenomena every year that measure lower or higher than the long-term average.
There is no simulation in which all aspects of climate change are strongly pronounced at the same time. For example, some of the simulations show severe summer dryness but moderate heavy precipitation events. It is therefore unlikely that the most extreme values for all climate parameters described would occur at the same time.
What data are available?
The CH2018 Climate Change Scenarios describe Switzerland’s future climate by means of numerous variables and indicators.
Averaged figures are available for temperature and precipitation, extreme temperatures and extreme precipitation events, as well as dryness indicators. These figures describe seasonal or annual changes for the regions of Switzerland.
Additional climate indicators such as hot days, tropical nights etc. indicate pronouncedly location-specific characteristics of the climate. These data are available for a range of meteorological stations throughout the country, and can also be obtained in the form of maps at a grid resolution of 2 x 2 km.
The data relate to the near future, the middle, and end of the 21st century, and are based on 30-year averages for each time period.
The CH2018 web atlas provides access to graphs for climate parameter averages for all emission scenarios, regions/locations and seasons, and offers the associated data for free download.
The base data that were used to calculate the climate indicators can be obtained free of charge from MeteoSwiss on request. These data are available as continuous daily time series of several climate variables for the period 1981-2099 at a large number of Swiss stations and on a high-resolution 2 x 2 km grid. Further information on the available data sets and the data access can be found on the CH2018 data page.
The validity of all of the data is subject to the limitations inherent in the methodology. These limitations are explained in detail in the Technical Report on the CH2018 Climate Change Scenarios. No guarantee can be made of the validity of the data.
Last modification 04.11.2025