Local changes in temperature and precipitation on the Swiss Plateau are similar to those projected on a larger scale. However, they do lead to different climate conditions depending on the topographical nature of the locality. In lower-lying areas, by the middle of this century, the temperature average could be as high as it currently is in Ticino.
Due to divergent local conditions, every station on the Swiss Plateau has a different normal temperature range; however, the projected future changes vary only slightly across the Swiss Plateau as a whole. For example, for Zurich/Fluntern, by the middle of this century, the average winter temperature will increase from 1.0°C today to a likely 3.0–4.2°C if greenhouse gas emissions continue to rise unabated (RCP8.5). In this scenario, the average summer temperature will be between 19.8°C and 21.5°C (compared to 17.7°C today). Such warming would result in temperatures that are normal for Locarno today.
We see a similar picture in the case of summer days – days in which the maximum temperature reaches at least 25°C. In Geneva, there are currently around 60 summer days per year; this is three times as many as in St Gallen, which is 350 m higher. Without climate change mitigation, St Gallen will reach current Geneva levels of summer days by the middle of this century. In Geneva, meanwhile, we can expect the number of summer days to double in comparison to the normal period of 1981–2010. The warmer summers will entail stress for for people, animals, and the environmen in the form of an increased number of tropical nights (nights during which the temperature does not fall below 20°C).
With regard to changes in precipitation, the models show only small differences between the various stations. In Zurich/Fluntern, the current average summer precipitation is 123 mm per month. Summer precipitation in the RCP8.5 scenario is projected to be between 96 mm and 138 mm per month by the middle of the century, thus ranging from a slight increase to a significant decrease. In the same scenario, winter precipitation is projected to increase from 70 mm to between 74 mm and 97 mm per month.
Currently, in the eastern part of the Swiss Plateau, more rain falls in the summer than in the winter. Locations such as St Gallen can therefore expect precipitation levels to be more equalised across the seasons in the future as a result of climate Change.
What do RCP2.6 and RCP8.5 mean? You can find an explanation of the emission scenarios here.
What does "the middle of the century" mean? You can find an explanation of the CH2018 time periods here.
Tables
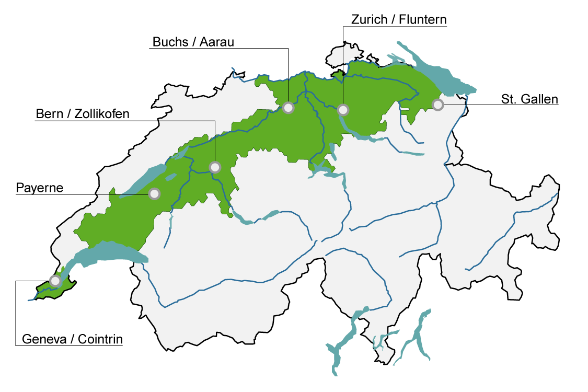
In the following tables, the seasonal absolute values for temperature, precipitation, and certain climate indicators for today (standard period of 1981–2010) and for the two emission scenarios (RCP2.6 and RCP8.5) around the middle of the century (2060) are shown for a selection of monitoring stations on the Swiss Plateau.
You can find data on other monitoring stations in the CH2018 web Atlas.
Temperature
|
Temperature in winter (°C) |
Temperature in summer (°C) |
|||||
|---|---|---|---|---|---|---|---|
Stations |
m a.s.l. |
Situation today |
Situation around 2060 |
Situation today |
Situation around 2060 |
||
RCP2.6 |
RCP8.5 |
RCP2.6 |
RCP8.5 |
||||
Bern/Zollikofen |
553 |
0.5 |
1.3 to 2.7 |
2.4 to 3.6 |
17.6 |
18.3 to 19.4 |
19.6 to 21.2 |
Buchs/Aarau |
387 |
1.3 |
2.0 to 3.3 |
3.3 to 4.2 |
18.1 |
18.8 to 19.8 |
20.0 to 21.6 |
Geneva/Cointrin |
411 |
2.3 |
3.0 to 4.2 |
4.2 to 5.2 |
19.3 |
20.0 to 21.2 |
21.4 to 23.0 |
Payerne |
490 |
0.9 |
1.7 to 3.1 |
2.9 to 4.2 |
17.9 |
18.6 to 19.7 |
19.9 to 21.4 |
St Gallen |
776 |
0.3 |
0.8 to 2.5 |
2.4 to 3.6 |
16.3 |
17.3 to 18.5 |
18.6 to 20.5 |
Zurich/Fluntern |
556 |
1.0 |
1.7 to 3.1 |
3.0 to 4.2 |
17.7 |
18.5 to 19.6 |
19.8 to 21.5 |
Legend
At the Zurich/Fluntern monitoring station, for example, by the middle of this century (2060), the average winter temperature will increase from 1.0°C today to a likely 3.0–4.2°C if greenhouse gas emissions continue to rise unabated (RCP8.5). In this scenario, an average summer temperature of between 19.8°C and 21.5°C is possible (compared to 17.7°C today). With consistent climate change mitigation (RCP2.6), the increase in winter temperatures in Zurich/Fluntern can be moderated, with average temperatures of 1.7–3.1 °C by 2060 . In summer, temperatures will only rise to around 18.5–19.6°C.
Precipitation
|
Precipitation in winter (mm/month) |
Precipitation in summer (mm/month) |
|||||
|---|---|---|---|---|---|---|---|
Stations |
m a.s.l. |
Situation today |
Situation around 2060 |
Situation today |
Situation around 2060 |
||
RCP2.6 |
RCP8.5 |
RCP2.6 |
RCP8.5 |
||||
Bern/Zollikofen |
553 |
63.3 |
62.5 to 80.6 |
69.9 to 85.4 |
108.5 |
77.1 to 116.4 |
62.2 to 108.7 |
Buchs/Aarau |
387 |
70.0 |
68.2 to 85.0 |
74.1 to 96.0 |
105.0 |
84.2 to 111.2 |
71.8 to 113.5 |
Geneva/Cointrin |
411 |
72.2 |
73.1 to 90.3 |
79.6 to 97.6 |
76.8 |
56.3 to 81.4 |
46.0 to 72.8 |
Payerne |
490 |
54.2 |
53.3 to 69.0 |
60.2 to 73.0 |
86.9 |
61.1 to 90.7 |
46.2 to 87.6 |
St Gallen |
776 |
65.5 |
66.6 to 84.5 |
72.3 to 90.5 |
158.1 |
132.3 to 191.3 |
129.6 to 177.7 |
Zurich/Fluntern |
556 |
70.1 |
68.0 to 85.4 |
73.9 to 97.5 |
122.6 |
103.3 to 135.3 |
95.9 to 137.9 |
Legend
At the Geneva/Cointrin monitoring station, the current precipitation normal is 76.8 mm per month during the summer months. Without any climate change mitigation (RCP8.5), summer precipitation will decrease during the period around 2060: Between 46.0 mm and 72.8 mm per month can be expected. In the same scenario, winter precipitation is projected to increase from 72.2 mm to 79.6–97.6 mm per month. If comprehensive measures are implemented to reduce greenhouse gas emissions (RCP2.6), the changes in precipitation can be mitigated. In summer, precipitation would then be between 56.3 mm and 81.4 mm per month (compared to 76.8 mm per month today), and in winter, between 73.1 mm and 90.3 mm per month (compared to 72.2 mm per month).
Summer days
Stations |
m a.s.l. |
Summer days now |
Summer days around 2060 |
|
|---|---|---|---|---|
RCP2.6 |
RCP8.5 |
|||
Bern / Zollikofen |
553 |
42 |
51 to 66 |
68 to 90 |
Buchs / Aarau |
387 |
51 |
60 to 73 |
77 to 96 |
Genf / Cointrin |
411 |
60 |
68 to 82 |
87 to 105 |
Payerne |
490 |
46 |
54 to 69 |
73 to 92 |
St. Gallen |
776 |
18 |
24 to 35 |
35 to 57 |
Zürich / Fluntern |
556 |
39 |
46 to 57 |
62 to 82 |
Legend
Currently, the monitoring station of Payerne has an average of 46.2 summer days (temperature of at least 25°C) per year. Without climate change mitigation (RCP8.5), there could be up to 91.9 summer days per year in Payerne by the middle of this century (2060). With consistent implementation of climate change mitigation (RCP2.6), the increase would be less pronounced, up to 69.0 summer days.
Tropical nights
Stations |
m a.s.l. |
Tropical nights now |
Tropical nights around 2060 |
|
|---|---|---|---|---|
RCP2.6 |
RCP8.5 |
|||
Bern/Zollikofen |
553 |
0.0 |
0.1 to 1.4 |
1.2 to 6.0 |
Buchs/Aarau |
387 |
0.0 |
0.2 to 1.3 |
1.1 to 7.2 |
Geneva/Cointrin |
411 |
0.4 |
1.4 to 4.9 |
4.8 to 16.7 |
Payerne |
490 |
0.0 |
0.0 to 1.1 |
0.8 to 5.8 |
St Gallen |
776 |
0.9 |
1.8 to 6.0 |
6.3 to 18.2 |
Zurich/Fluntern |
556 |
0.3 |
1.3 to 4.3 |
5.2 to 14.2 |
Legend
At the Bern/Zollikofen monitoring station, tropical nights were so rare in the normal period of 1981–2010 as to result in an average of 0.0 per year. Without climate change mitigation (RCP8.5), there could be on average up to 6 tropical nights per year at this station by the middle of this century (2060). With consistent climate change mitigation (RCP2.6), the average number of tropical nights would be limited to up to 1.4 per year.
Frost days
Stations |
m a.s.l. |
Frost days now |
Frost days around 2060 |
|
|---|---|---|---|---|
RCP2.6 |
RCP8.5 |
|||
Bern / Zollikofen |
553 |
94 |
67 to 85 |
53 to 69 |
Buchs / Aarau |
387 |
78 |
55 to 70 |
42 to 58 |
Genf / Cointrin |
411 |
75 |
49 to 64 |
37 to 54 |
Payerne |
490 |
91 |
61 to 80 |
48 to 65 |
St. Gallen |
776 |
93 |
64 to 84 |
51 to 65 |
Zürich / Fluntern |
556 |
74 |
49 to 64 |
38 to 51 |
Legend
The monitoring station of Buchs/Aarau has an average of 78 frost days (minimum temperature below 0°C) per year. Without climate change mitigation (RCP8.5), the number of frost days in Buchs/Aarau is projected to decrease to 41.8–58.2 per year by the middle of this century (2060). With consistent climate change mitigation, there will be a smaller reduction in the number of frost days per year, to 54.5–69.5.
Days with fresh snowfall
Stations |
m a.s.l. |
Days with fresh snowfall now |
Days with fresh snowfall around 2060 |
|
|---|---|---|---|---|
RCP2.6 |
RCP8.5 |
|||
Bern / Zollikofen |
553 |
15 |
11 to 20 |
7 to 16 |
Buchs / Aarau |
387 |
12 |
8 to 15 |
5 to 12 |
Genf / Cointrin |
411 |
7 |
4 to 10 |
2 to 6 |
Payerne |
490 |
10 |
8 to 15 |
5 to 12 |
St. Gallen |
776 |
26 |
14 to 28 |
10 to 22 |
Zürich / Fluntern |
556 |
17 |
1 to 18 |
7 to 15 |
Legend
St Gallen has one of the highest-altitude monitoring stations on the Swiss Plateau. Here, an average of 25.7 days with fresh snowfall (minimum of 1 mm of precipitation falling in the form of snow) per year were recorded during the normal period of 1981–2010. Without climate change mitigation (RCP8.5), the number of days with fresh snowfall per year will decrease to 9.5–22.3 at the St Gallen monitoring station by the middle of the century (2060). With consistent climate change mitigation (RCP2.6), there will be a smaller reduction in the number of days of fresh snowfall per year, to 13.8–28.2; a slight increase cannot be ruled out.
Charts
The interactive charts for all indicators use Zurich/Fluntern as an example. You can find the figures for other stations in the CH2018 web Atlas.
Zürich / Fluntern
What do RCP2.6 and RCP8.5 mean? You can find an explanation of the emission scenarios here.
Last modification 26.06.2024