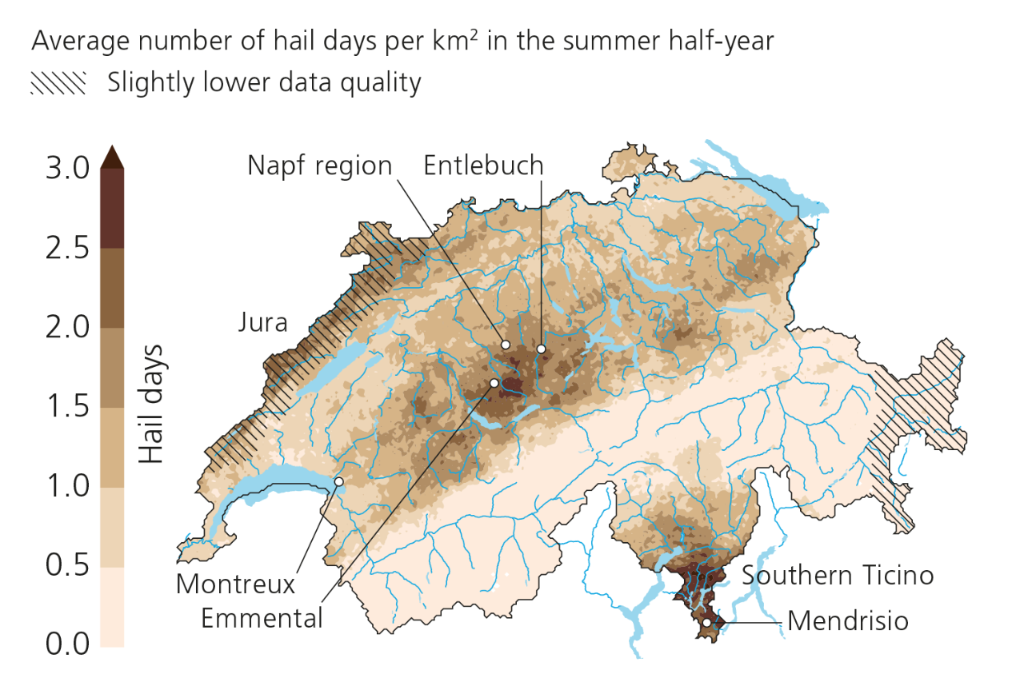
Information on the frequency of hail events is important for agriculture, as even small hailstones can cause considerable damage. In Switzerland, damage to agricultural crops due to hail amounts to around 65 million Swiss Francs every year. Hail is most common in the summer months. The regions of southern Ticino, Emmental, Entlebuch, and Napf, as well as along the Jura are most severely affected.
Hail Days in Switzerland
Hail frequency is expressed here in terms of the number of hail days, a phenomenon that occurs regularly in Switzerland. Across the entire data series, an average of 33 hail days* per summer half-year are observed across Switzerland.
The number of hail days is spatially unevenly distributed across the country. Especially in southern Ticino, Emmental, Entlebuch, and the Napf region, as well as along the Jura, there are areas in which hail can be expected quite often. In some parts of southern Ticino, it hails up to three times a year on average. The minimum number of hail days is found in the inner-Alpine regions, where in isolated incidents no hail days at all have been registered since 2002.
* This refers to days in which an area of at least 100 km2 throughout Switzerland is affected.
Hail Days

Temporal Development of Hail Days
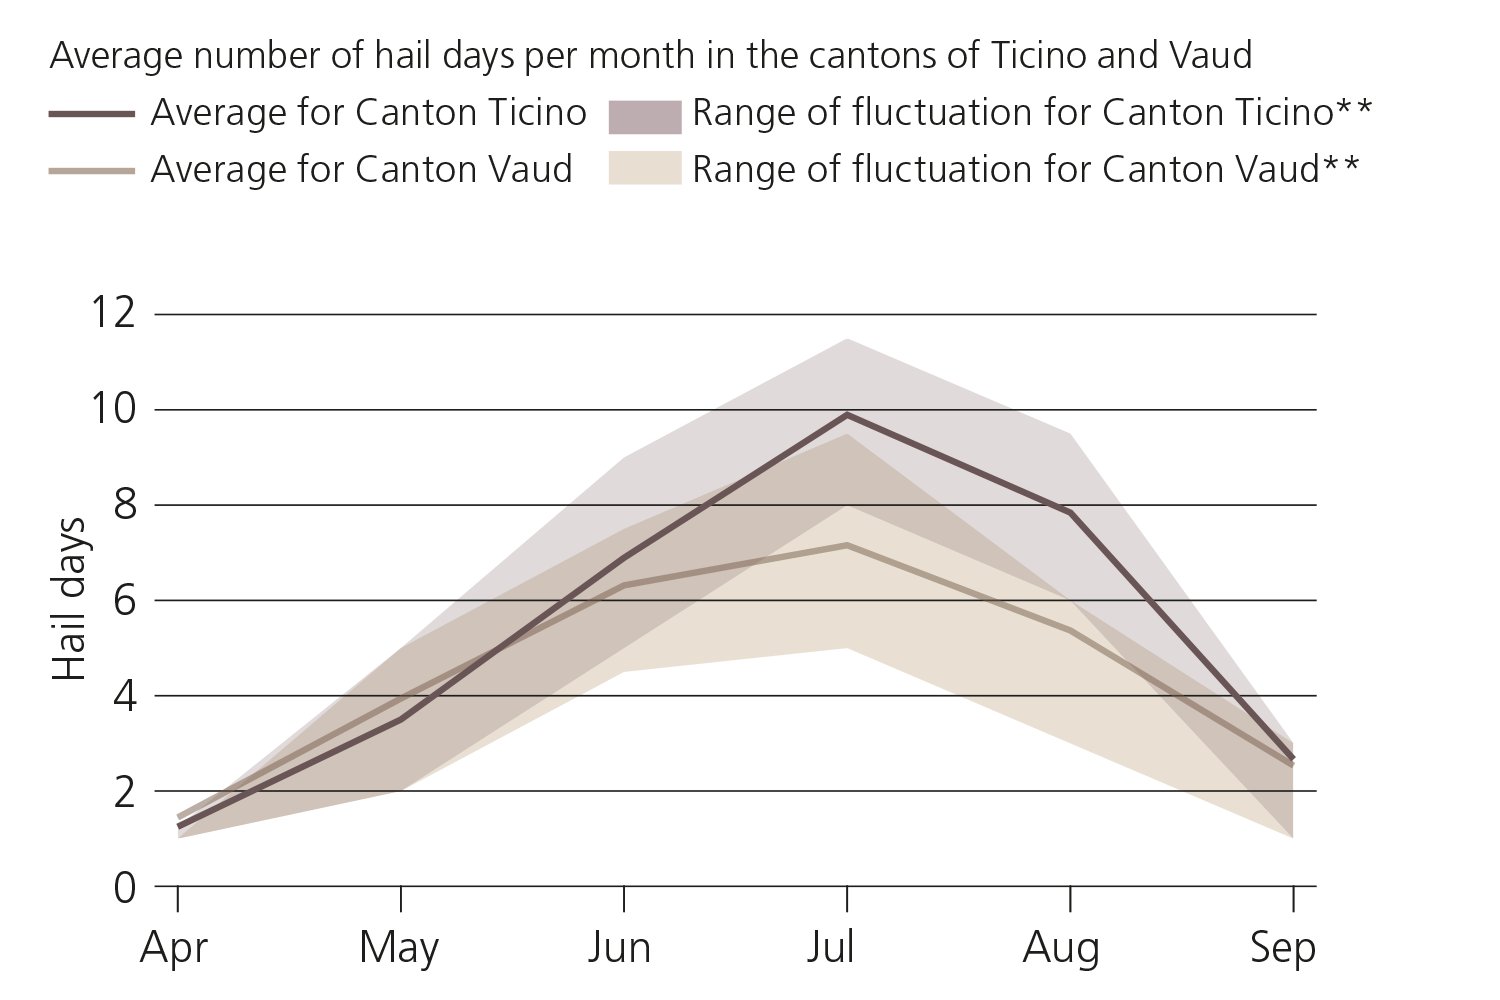
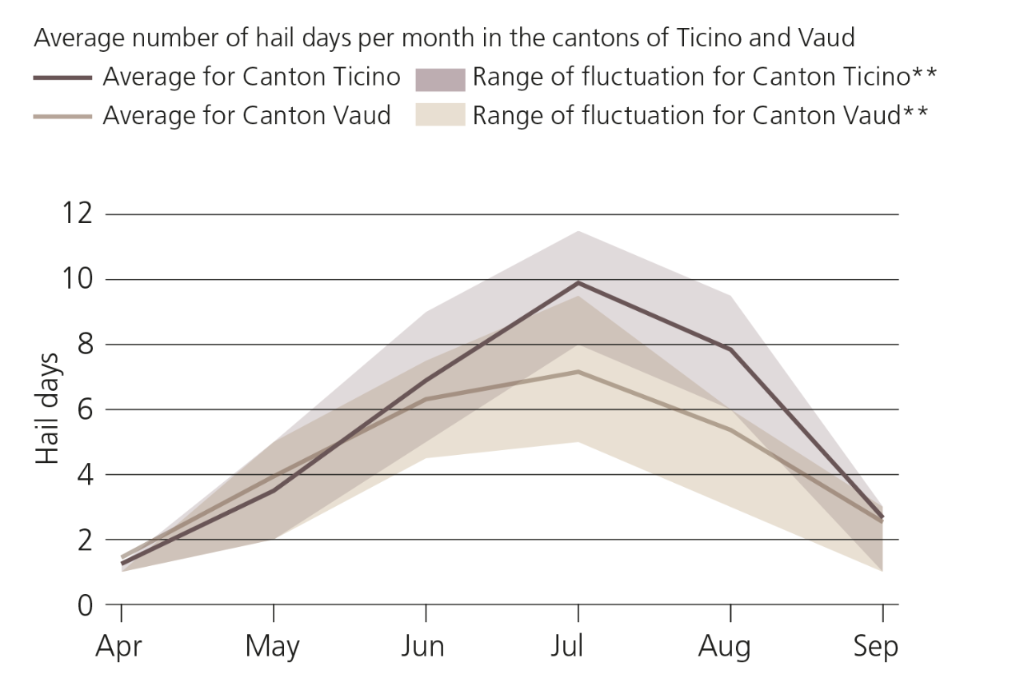
Hail days are less likely from October to March than during the summer half-year. The maximum number of hail days per month is observed in the period between June and August, as the thunderclouds in which hailstones can form occur more frequently in the summer.
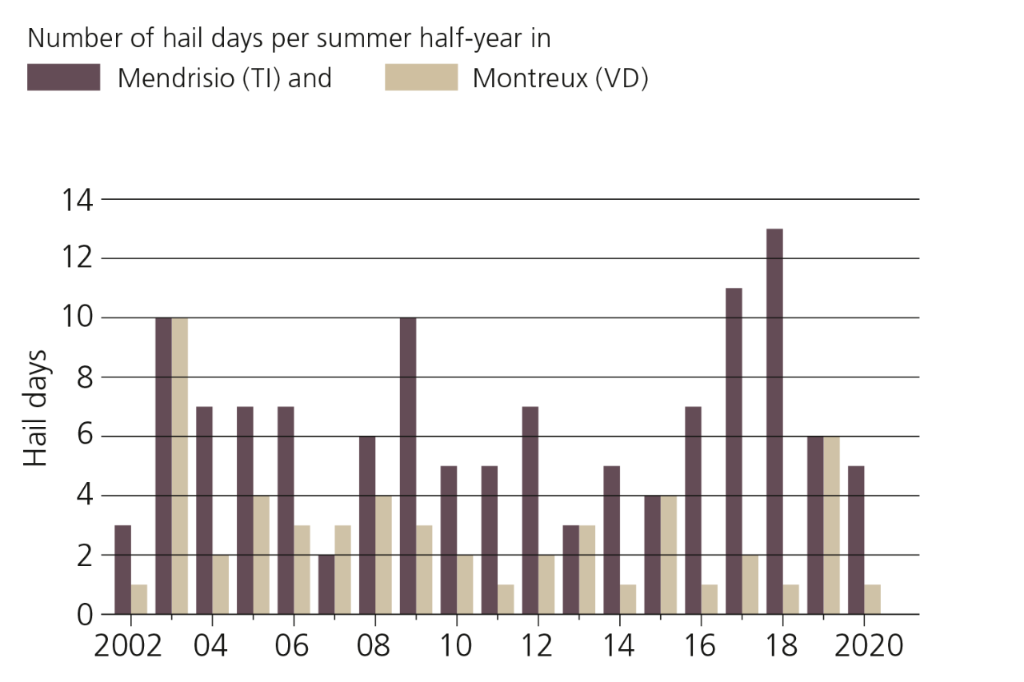
The number of hail days fluctuates considerably from year to year due to meteorological conditions, as can be clearly seen in the example of the time series for the municipalities of Mendrisio and Montreux.
Annual Cycle of Hail Days
Time Series of Hail Days

Last modification 11.05.2021