The extent of summer warming in the Alps is expected to be greater than in the other regions of Switzerland; at the same time, the increase in winter precipitation in that region is less pronounced. If greenhouse gas emissions continue to rise unabated, many locations in the Alps will end up below the winter zero-degree isotherm which were previously above it, and the number of days with fresh snow can be expected to decrease significantly.
In the event that greenhouse gas emissions continue to increase unchecked (RCP8.5 emission scenario), the winter zero-degree isotherm, which is currently around 800 m a.s.l., will rise by several hundred metres as a result of the warming. This means that many stations located at medium altitudes (e.g., Adelboden and Disentis) that today record on average below-zero temperatures over the winter months will experience average temperatures above 0°C by the middle of the century .
In Adelboden, for example, by the middle of this century, the average winter temperature will increase from -1.1°C today to a likely 0.7–1.9°C if greenhouse gas emissions continue to rise unabated (RCP8.5). Because of the increasing winter temperatures, the number of days with fresh snowfall will decrease significantly compared to the present. Just over half the number of fresh snowfall days compared to today are expected in Adelboden, Disentis, and Zermatt by the middle of the century.
In the summer months, the extent of the warming is generally more pronounced in the Alps than in the lowlands and tends to increase with altitude. Without climate change mitigation (RCP8.5), stations in the valleys, such as Chur, will have summer temperatures similar to those recorded on average at the warmest stations in Ticino today. The higher-altitude stations of Adelboden and Zermatt will possibly see temperatures that are typical of the Swiss Plateau. Similarly, the number of summer days (i.e., days on which the temperature exceeds 25°C) experienced in Zermatt by the middle of the century will correspond to that recorded in Bern today.
The projected changes in precipitation in winter are generally less pronounced, percentage-wise, than in the lowlands, whereas the changes in the summer months are similar in the two regions. In Adelboden, for example, the current average summer precipitation is 150 mm per month. Summer precipitation without climate change mitigation (RCP8.5) is projected to be between 110 mm and 154 mm per month by the middle of the century, thus ranging from a slight increase to a significant decrease. In the same scenario, winter precipitation is projected to range from 92 mm to 117 mm per month (compared to 93 mm per month today).
What do RCP2.6 and RCP8.5 mean? You can find an explanation of the emission scenarios here.
What does "the middle of the century" mean? You can find an explanation of the CH2018 time periods here.
Tables
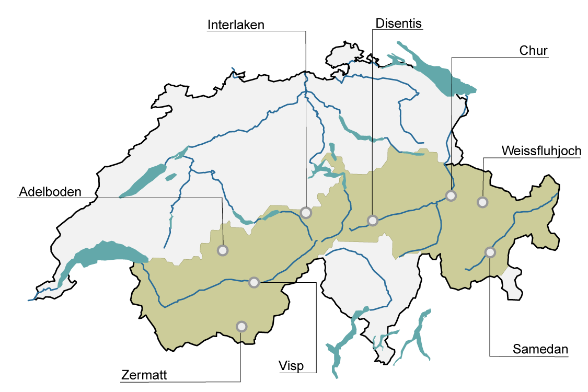
In the following tables, the seasonal absolute values for temperature, precipitation, and certain climate indicators for the present (standard period 1981–2010) and for the two emission scenarios (RCP2.6 and RCP8.5) around the middle of the century (2060) are shown for a selection of monitoring stations in the Alps.
You can find data on other monitoring stations in the CH2018 web Atlas.
Temperature
|
Temperature in winter (°C) |
Temperature in summer (°C) |
|||||
|---|---|---|---|---|---|---|---|
Stations |
m a.s.l.[C1] |
Situation today |
Situation around 2060 |
Situation today |
Situation around 2060 |
||
RCP2.6 |
RCP8.5 |
RCP2.6 |
RCP8.5 |
||||
Adelboden |
1322 |
-1.1 |
-0.5 to +0.6 |
+0.7 to +1.9 |
+13.5 |
+14.5 to +16.4 |
+16.1 to +19.4 |
Chur |
556 |
+1.1 |
+1.7 to +3.1 |
+3.1 to +4.3 |
+18.0 |
+18.8 to +20.3 |
+20.3 to +23.0 |
Disentis |
1197 |
-1.1 |
-0.4 to +0.9 |
+0.9 to +1.9 |
+14.6 |
+15.7 to +17.5 |
+17.2 to +20.5 |
Interlaken |
577 |
+0.2 |
+1.0 to +2.1 |
+1.9 to +3.0 |
+17.2 |
+17.9 to +19.0 |
+19.2 to +21.0 |
Samedan |
1708 |
-8.3 |
-7.3 to -5.8 |
-5.7 to -4.6 |
+11.1 |
+11.9 to +13.9 |
+13.2 to +15.9 |
Visp |
639 |
-0.3 |
+0.8 to +1.9 |
+2.2 to +3.3 |
+18.4 |
+19.1 to +20.8 |
+20.5 to +23.0 |
Weissfluhjoch |
2691 |
-8.1 |
-7.7 to -6.3 |
-6.4 to -5.3 |
+4.9 |
+6.0 to +7.5 |
+7.5 to +10.3 |
Zermatt |
1638 |
-3.6 |
-2.8 to -1.9 |
-2.0 to -0.8 |
+12.5 |
+13.5 to +16.2 |
+15.2 to +19.1 |
Legend
At the Disentis monitoring station, for example, by the middle of this century (2060), the average winter temperature may increase from -1.1°C today to up to +1.9°C if greenhouse gas emissions continue to rise unabated (RCP8.5). In this scenario, an average summer temperature of between 17.2°C and 20.5°C is possible (compared to 14.6°C today). With consistent climate change mitigation (RCP2.6), the increase in winter temperatures in Disentis can be moderated, with average temperatures reaching -0.4°C to +0.9°C by 2060. In summer, temperatures will only rise to around 15.7–17.5°C.
Precipitation
|
Winter precipitation (mm/month) |
Summer precipitation (mm/month) |
|||||
|---|---|---|---|---|---|---|---|
Stations |
m a.s.l. |
Situation today |
Situation around 2060 |
Situation today |
Situation around 2060 |
||
RCP2.6 |
RCP8.5 |
RCP2.6 |
RCP8.5 |
||||
Adelboden |
1322 |
93 |
87 to 111 |
92 to 117 |
150 |
116 to 150 |
110 to 154 |
Chur |
556 |
51 |
49 to 66 |
54 to 70 |
104 |
74 to 104 |
63 to 113 |
Disentis |
1197 |
63 |
58 to 82 |
62 to 85 |
111 |
86 to 122 |
80 to 125 |
Interlaken |
577 |
74 |
69 to 96 |
78 to 98 |
134 |
96 to 136 |
78 to 132 |
Samedan |
1708 |
27 |
28 to 39 |
26 to 41 |
88 |
66 to 100 |
65 to 106 |
Visp |
639 |
52 |
48 to 65 |
52 to 69 |
43 |
34 to 49 |
29 to 53 |
Weissfluhjoch |
2691 |
94 |
86 to 111 |
94 to 120 |
175 |
127 to 167 |
110 to 175 |
Zermatt |
1638 |
41 |
37 to 60 |
37 to 53 |
61 |
43 to 67 |
44 to 65 |
Legend
At the Adelboden monitoring station, the current average precipitation is 150 mm per month during the summer months. During the period around 2060, the summer precipitation trend without any climate change mitigation (RCP8.5) shows a decrease: Between 110 mm and 154 mm per month can be expected. In the same scenario, the winter precipitation trend indicates a likely increase from 93 mm to 92–to117 mm per month. If comprehensive measures are implemented to reduce greenhouse gas emissions (RCP2.6), the changes in precipitation can be mitigated slightly. In summer, precipitation would then be between 116 mm and 150 mm per month (compared to 150 mm per month today), and in winter, between 87 mm and 111 mm per month (compared to 93 mm per month today).
Summer days
Stations |
m a.s.l. |
Summer days now |
Summer days around 2060 |
|
|---|---|---|---|---|
RCP2.6 |
RCP8.5 |
|||
Adelboden |
1322 |
7 |
11 to 23 |
23 to 61 |
Chur |
556 |
49 |
58 to 73 |
76 to 102 |
Disentis |
1197 |
19 |
28 to 41 |
43 to 75 |
Interlaken |
577 |
39 |
50 to 64 |
65 to 91 |
Samedan |
1708 |
2 |
5 to 13 |
14 to 40 |
Visp |
639 |
64 |
76 to 97 |
97 to 127 |
Weissfluhjoch |
2691 |
0 |
0 |
0 to 1 |
Zermatt |
1638 |
6 |
11 to 27 |
27 to 76 |
Legend
Currently, the monitoring station of Interlaken observes an average of 39 summer days (temperature of at least 25°C) per year. Without climate change mitigation (RCP8.5), there could be up to 91 summer days per year in Interlaken by the middle of this century (2060). With consistent implementation of climate change mitigation (RCP2.6), the increase would be less drastic, up to 64 summer days.
Tropical nights
Stations |
m a.s.l. |
Tropical nights now |
Tropical nights around 2060 |
|
|---|---|---|---|---|
RCP2.6 |
RCP8.5 |
|||
Adelboden |
1322 |
0.0 |
0.0 to 0.1 |
0.0 to 2.9 |
Chur |
556 |
0.1 |
0.6 to 2.5 |
2.8 to 15.2 |
Disentis |
1197 |
0.0 |
0.0 to 0.2 |
0.1 to 3.4 |
Interlaken |
577 |
0.0 |
0.1 to 1.0 |
0.8 to 5.6 |
Samedan |
1708 |
0.0 |
0.0 |
0.0 |
Visp |
639 |
0.1 |
0.0 to 0.4 |
0.3 to 4.0 |
Weissfluhjoch |
2691 |
0.0 |
0.0 |
0.0 |
Zermatt |
1638 |
0.0 |
0.0 |
0.0 to 0.2 |
Legend
At the Chur monitoring station, tropical nights are an exception in the current climate (over the normal period of 1981–2010), with 0.1 per year. By the middle of this century (2060), there could be 15.2 tropical nights per year at this station. With consistent climate change mitigation (RCP2.6), the average number of tropical nights would be limited to up to 2.5 per year.
Frost days
Stations |
m a.s.l. |
Frost days now |
Frost days around 2060 |
|
|---|---|---|---|---|
RCP2.6 |
RCP8.5 |
|||
Adelboden |
1322 |
136 |
105 to 131 |
88 to 110 |
Chur |
556 |
84 |
57 to 77 |
45 to 61 |
Disentis |
1197 |
128 |
99 to 123 |
83 to 101 |
Interlaken |
577 |
100 |
74 to 96 |
60 to 76 |
Samedan |
1708 |
235 |
199 to 222 |
175 to 200 |
Visp |
639 |
114 |
87 to 110 |
71 to 90 |
Weissfluhjoch |
2691 |
263 |
226 to 250 |
195 to 223 |
Zermatt |
1638 |
173 |
150 to 171 |
132 to 153 |
Legend
The monitoring station of Samedan observes an average of 235 frost days (minimum temperature below 0°C) per year. Without climate change mitigation (RCP8.5), the number of frost days in Samedan is projected to decrease to 175–200 per year by the middle of this century (2060). With consistent climate change mitigation, there will be a smaller reduction in the number of frost days per year, to 199–222.
Days with fresh snowfall
Stations |
m a.s.l. |
Days with fresh snowfall now |
Days with fresh snowfall around 2060 |
|
|---|---|---|---|---|
RCP2.6 |
RCP8.5 |
|||
Adelboden |
1322 |
42 |
24 to 40 |
18 to 32 |
Chur |
556 |
13 |
6 to 15 |
4 to 11 |
Disentis |
1197 |
34 |
15 to 28 |
11 to 23 |
Interlaken |
577 |
17 |
13 to 24 |
9 to 19 |
Samedan |
1708 |
28 |
20 to 36 |
18 to 29 |
Visp |
639 |
11 |
7 to 14 |
4 to 11 |
Weissfluhjoch |
2691 |
105 |
86 to 103 |
76 to 93 |
Zermatt |
1638 |
30 |
17 to 29 |
14 to 24 |
Legend
During the normal period of 1981 to 2010, the Weissfluhjoch monitoring station recorded an average of 105 days with fresh snowfall (a minimum of 1 mm of precipitation falling in the form of snow) per year. Without climate change mitigation (RCP8.5), the number of days with fresh snowfall per year will decrease to 76–93 at the Weissfluhjoch station by the middle of the century (2060). With consistent climate change mitigation (RCP2.6), there will be a smaller reduction in the number of days of fresh snowfall per year, to 86–103.
Charts
The interactive charts for all indicators use Zermatt as an example. You can find the figures for other stations in the CH2018 web Atlas.
Zermatt
What do RCP2.6 and RCP8.5 mean? You can find an explanation of the emission scenarios here.
Last modification 26.06.2024