In southern Switzerland, warming without climate change mitigation will result in temperatures similar to those experienced in northern and central Italy today. Along the shores of the Ticino lakes, the number of tropical nights is on the increase, and at higher altitudes, summery temperatures are becoming more prevalent in the warm season.
South of the Alps, future summer temperatures will be similar to those typical of Florence and Rome today. In Lugano, for example, summer temperatures between 23.0°C and 24.4°C (compared to 21.1°C today) are a possibility without consistent climate change mitigation (RCP8.5 emission scenario). At higher altitudes, summer temperatures are projected to rise significantly as well. In San Bernardino, current summer temperatures of 11.9°C could rise to 17.3°C – thus exceeding the average summer temperature experienced today in lower-lying Piotta.
A comparable picture is seen in the case of summer days, days on which the temperature reaches at least 25°C: Along the shores of the lakes in Ticino, at least 60 summer days per year is considered normal; this is around three times as many as in Piotta, which is located at an altitude of 1,000 m a.s.l. Without climate change mitigation (RCP8.5), Piotta will experience temperatures similar to those recorded today in Lugano and Locarno in the middle of the century. In the latter areas, an increase to around 100 summer days is expected. In lower-lying areas, the impact of warmer summers will be compounded by the increase in tropical nights (nights when temperatures do not drop below 20°C). Near the lakes in Ticino, around 10 tropical nights a year are already the norm in today’s climate. By the middle of the century, this figure could be as high as around 40 per year.
The projected trend for precipitation suggests a decrease in summer and an increase in winter. Without climate change mitigation (RCP8.5), in the summer months in Locarno, for example, there may be between 112 mm and 210 mm of precipitation per month by the middle of this century (compared to 188 mm today). In winter, between 64 mm and 108 mm per month can be expected (compared to 72 mm today). However, changes that run contrary to the current trend cannot be ruled out.
What do RCP2.6 and RCP8.5 mean? You can find an explanation of the emission scenarios here.
What does "the middle of the century" mean? You can find an explanation of the CH2018 time periods here.
Tables
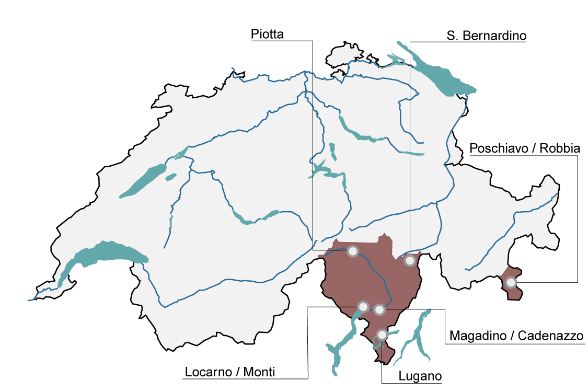
In the following tables, the seasonal absolute values for temperature, precipitation, and certain climate indicators for the present (standard period 1981–2010) and for the two emission scenarios (RCP2.6 and RCP8.5) around the middle of the century (2060) are shown for a selection of monitoring stations south of the Alps.
You can find data on other monitoring stations in the CH2018 web Atlas.
Temperature
|
Temperature in winter (°C) |
Temperature in summer (°C) |
|||||
|---|---|---|---|---|---|---|---|
Stations |
m a.s.l. |
Situation today |
Situation around 2060 |
Situation today |
Situation around 2060 |
||
RCP2.6 |
RCP8.5 |
RCP2.6 |
RCP8.5 |
||||
Locarno / Monti |
367 |
+4.0 |
+4.6 to +5.9 |
+5.9 to +7.1 |
+20.9 |
+21.8 to +22.9 |
+23.0 to +24.4 |
Lugano |
273 |
+4.1 |
+4.8 to +5.9 |
+5.9 to +6.9 |
+21.1 |
+21.9 to +23.0 |
+23.0 to +24.4 |
Magadino |
203 |
+2.1 |
+3.0 to +4.2 |
+4.3 to +5.5 |
+20.8 |
+21.6 to +22.7 |
+22.7 to +24.0 |
Piotta |
990 |
-0.7 |
+0.2 to +1.2 |
+1.4 to +2.2 |
+16.3 |
+17.1 to +18.6 |
+18.4 to +21.0 |
Poschiavo / Robbia |
1078 |
-1.2 |
-0.4 to +0.6 |
+0.8 to +1.8 |
+15.3 |
+16.2 to +17.4 |
+17.4 to +19.8 |
S. Bernadino |
1639 |
-3.4 |
-2.7 to -1.7 |
-1.6 to -0.8 |
+11.9 |
+12.6 to +14.2 |
+14.0 to +17.3 |
Legend
At the Magadino monitoring station, for example, by the middle of this century (2060), the average winter temperature will probably increase from 2.1°C today to a likely 4.3°C to 5.5°C if greenhouse gas emissions continue to rise unabated (RCP8.5). In this scenario, an average summer temperature between 22.7°C and 24.0°C is possible (compared to 20.8°C today). With consistent climate change mitigation (RCP2.6), the increase in winter temperatures on the Magadino plain can be moderated, with average temperatures of 3.0–4.2°C by 2060 . In summer, temperatures will only rise to around 21.6–22.7°C.
Precipitation
|
Precipitation in winter (mm/month) |
Precipitation in summer (mm/month) |
|||||
|---|---|---|---|---|---|---|---|
Stations |
m a.s.l. |
Situation today |
Situation around 2060 |
Situation today |
Situation around 2060 |
||
RCP2.6 |
RCP8.5 |
RCP2.6 |
RCP8.5 |
||||
Locarno / Monti |
367 |
72 |
68 to 111 |
64 to 108 |
188 |
138 to 229 |
112 to 210 |
Lugano |
273 |
66 |
61 to 101 |
58 to 91 |
155 |
122 to 189 |
101 to 180 |
Magadino |
203 |
73 |
68 to 112 |
64 to 105 |
172 |
140 to 214 |
116 to 213 |
Piotta |
990 |
69 |
66 to 91 |
65 to 92 |
135 |
107 to 155 |
97 to 153 |
Poschiavo / Robbia |
1078 |
52 |
52 to 81 |
45 to 77 |
108 |
96 to 134 |
89 to 134 |
S. Bernadino |
1639 |
82 |
84 to 113 |
80 to 116 |
182 |
144 to 206 |
129 to 206 |
Legend
At the Poschiavo/Robbia monitoring station, the current average precipitation is 108 mm per month during the summer months. For the period around 2060, reductions or increases in summer precipitation are both possible outcomes. Without climate change mitigation (RCP8.5), levels between 89 mm and 134 mm per month are possible. In the same scenario, the trend for winter precipitation suggests a tendency towards an increase (45–77 mm per month for the period around 2060, compared to 52 mm per month today). If comprehensive measures are implemented to reduce greenhouse gas emissions (RCP2.6), the changes in precipitation can be mitigated. In summer, precipitation would then be between 96 mm and 134 mm per month (compared to 108 mm per month today), and in winter, between 52 mm and 81 mm per month (compared to 52 mm per month).
Summer days
Stations |
m a.s.l. |
Summer days now |
Summer days around 2060 |
|
|---|---|---|---|---|
RCP2.6 |
RCP8.5 |
|||
Locarno / Monti |
367 |
69 |
80 to 94 |
99 to 114 |
Lugano |
273 |
65 |
77 to 90 |
94 to 109 |
Magadino |
203 |
79 |
91 to 105 |
109 to 122 |
Piotta |
990 |
23 |
34 to 46 |
59 to 74 |
Poschiavo / Robbia |
1078 |
19 |
28 to 42 |
44 to 72 |
S. Bernadino |
1639 |
1 |
1 to 6 |
4 to 27 |
Legend
Currently, the monitoring station of Locarno/Monti records an average of 69 summer days (temperature of at least 25°C) per year. Without climate change mitigation (RCP8.5), there could be up to 114 summer days per year in Locarno/Monti by the middle of this century (2060). With consistent implementation of climate change mitigation (RCP2.6), the increase would be somewhat less, up to 94 summer days.
Tropical nights
Stations |
m a.s.l. |
Tropical nights now |
Tropical nights around 2060 |
|
|---|---|---|---|---|
RCP2.6 |
RCP8.5 |
|||
Locarno / Monti |
367 |
8.0 |
15.6 to 27.0 |
31.2 to 51.9 |
Lugano |
273 |
11.3 |
20.7 to 32.9 |
38.9 to 58.1 |
Magadino |
203 |
2.1 |
5.9 to 13.6 |
15.3 to 34.3 |
Piotta |
990 |
0.0 |
0.0 to 0.2 |
0.2 to 3.6 |
Poschiavo / Robbia |
1078 |
0.0 |
0.0 to 0.1 |
0.0 to 1.3 |
S. Bernadino |
1639 |
0.0 |
0.0 to 0.0 |
0.0 to 0.2 |
Legend
At the monitoring station in Lugano, an average of 11.3 tropical nights per year occurred during the normal period of 1981–2010. Without climate change mitigation (RCP8.5), there could be on average¬ up to 58 tropical nights per year at this station by the middle of this century (2060). With consistent climate change mitigation (RCP2.6), the average number of tropical nights would be limited to up to 33 per year.
Frost days
Stations |
m a.s.l. |
Frost days now |
Frost days around 2060 |
|
|---|---|---|---|---|
RCP2.6 |
RCP8.5 |
|||
Locarno / Monti |
367 |
30 |
13 to 27 |
6 to 15 |
Lugano |
273 |
28 |
12 to 24 |
5 to 14 |
Magadino |
203 |
92 |
65 to 84 |
44 to 65 |
Piotta |
990 |
114 |
90 to 109 |
75 to 90 |
Poschiavo / Robbia |
1078 |
140 |
114 to 134 |
92 to 117 |
S. Bernadino |
1639 |
177 |
150 to 171 |
131 to 153 |
Legend
The monitoring location of Piotta in the Leventina has an average of 114 frost days (minimum temperature below 0°C) per year. Without climate change mitigation (RCP8.5), the number of frost days in Piotta is projected to decrease to 75–90 per year by the middle of this century (2060). With consistent climate change mitigation, there will be a smaller reduction in the number of frost days per year, to 90–109.
Days with fresh snowfall
Stations |
m a.s.l. |
Days with fresh snowfall now |
Days with fresh snowfall around 2060 |
|
|---|---|---|---|---|
RCP2.6 |
RCP8.5 |
|||
Locarno / Monti |
367 |
6 |
0 to 2 |
0 to 1 |
Lugano |
273 |
4 |
0 to 1 |
0 to 1 |
Magadino |
203 |
7 |
1 to 5 |
1 to 4 |
Piotta |
990 |
24 |
11 to 21 |
8 to 18 |
Poschiavo / Robbia |
1078 |
18 |
7 to 16 |
5 to 11 |
S. Bernardino |
1639 |
46 |
27 to 43 |
20 to 37 |
Legend
At the San Bernardino monitoring station, an average of 46 days with fresh snowfall (minimum of 1 mm of precipitation falling in the form of snow) per year were recorded during the normal period of 1981–2010. Without climate change mitigation (RCP8.5), the number of days with fresh snowfall per year will decrease to 20–37 by the middle of the century (2060). With consistent climate change mitigation (RCP2.6), there will be a smaller reduction in the number of days of fresh snowfall days per year, to 27-43.
Charts
The interactive charts for all indicators use Lugano as an example. You can find the figures for other stations in the CH2018 web Atlas.
Lugano
What do RCP2.6 and RCP8.5 mean? You can find an explanation of the emission scenarios here.
Last modification 26.06.2024