As temperatures rise, the climatic altitude levels of the Pre-Alps shift to higher altitudes. Likewise, the zero-degree isotherm in winter rises to higher altitudes. This significantly reduces the number of fresh snowfall days at many stations. The number of summer days increases at lower and medium altitudes.
As a result of warming, the zero-degree isotherm in winter (currently about 800 m above sea level) will rise by several hundred metres This means that without climate change mitigation (emission scenario RCP8.5), stations located at medium altitudes (e.g., Château-d'Oex and Napf) that today record on average below-zero temperatures over the winter months will experience average temperatures above 0°C by the middle of the century. Particularly at medium and high altitudes, the number of fresh snowfall days dramatically decreases – at the Napf station, for example, from about 56 to between 27 and 39 by the middle of the century.
At low altitudes in the Alpine foothills, temperatures similar to those in southern Ticino today may be found in the future. In Lucerne, for example, by the middle of this century, the average winter temperature will increase from 1.2°C to a likely 3.0–4.0°C if greenhouse gas emissions continue to rise unabated (RCP8.5). In this scenario, the average summer temperature will be between 20.2°C and 22.0°C (compared to 18.2°C today).
With increasing temperatures, the number of summer days (days on which temperatures exceed 25°C) also rises. In Château-d'Oex, located at 1,000 m a.s.l., about half as many summer days per year are recorded as in Lucerne, which is about 600 m lower. Without climate protection (RCP8.5), the number of summer days in Château-d'Oex will increase two to three times by the middle of the century, potentially exceeding the current level in Lucerne significantly. During the same period, the number of summer days in Lucerne may double. The increased occurrence of tropical nights (nights when the temperature does not fall below 20°C) means that these warmer summers will entail stress at lower altitudes.
In general, precipitation in the Alpine foothills will decrease in summer and increase in winter. This trend can be seen at the individual monitoring stations. In Lucerne, for example, the current normal average summer precipitation is 151 mm per month. Summer precipitation without climate change mitigation (RCP8.5) is projected to be between 95 mm and 149 mm per month by the middle of the century, ranging from current levels to a significant decrease. In the same scenario, winter precipitation is projected to increase from 61 mm to 66–81 mm per month. As a result, more balanced seasonal rainfall can be expected in Lucerne due to climate change.
What do RCP2.6 and RCP8.5 mean? You can find an explanation of the emission scenarios here.
What does "the middle of the century" mean? You can find an explanation of the CH2018 time periods here.
Tables
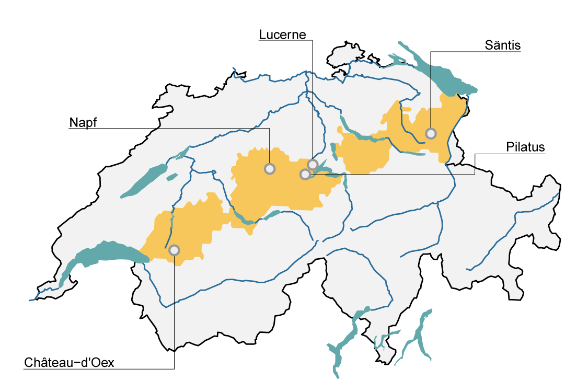
In the following tables, the seasonal absolute values for temperature, precipitation, and certain climate indicators for today (standard period of 1981–2010) and for the two emission scenarios (RCP2.6 and RCP8.5) around the middle of the century (2060) are shown for a selection of monitoring stations in the Alpine foothills.
You can find data on other monitoring stations in the CH2018 web Atlas.
Temperature
|
Temperature in winter (°C) |
Temperature in summer (°C) |
|||||
|---|---|---|---|---|---|---|---|
Stations |
m a.s.l. |
Situation |
Situation around 2060 |
Situation |
Situation around 2060 |
||
RCP2.6 |
RCP8.5 |
RCP2.6 |
RCP8.5 |
||||
Château-d'Oex |
1028 |
-1.4 |
-0.5 to +0.6 |
+0.8 to +1.6 |
+15.3 |
+16.1 to +17.3 |
+17.3 to +19.2 |
Lucerne |
454 |
+1.2 |
+1.9 to +3.2 |
+3.0 to +4.0 |
+18.2 |
+18.9 to +20.1 |
+20.2 to +22.0 |
Napf |
1404 |
-1.5 |
-1.1 to +0.5 |
+0.4 to +1.5 |
+12.6 |
+13.7 to +15.2 |
+15.2 to +17.4 |
Pilatus |
2106 |
-4.0 |
-3.7 to -2.1 |
-2.3 to -1.1 |
+8.4 |
+9.5 to +10.9 |
+11.0 to +13.1 |
Säntis |
2502 |
-6.9 |
-6.7 to -5.0 |
-5.0 to -3.9 |
+5.4 |
+6.5 to +7.8 |
+7.9 to +9.7 |
Legend
At the Napf monitoring station, for example, by the middle of this century (2060), the average winter temperature will probably increase from -1.5°C today to a likely +0.4°C to 1.5°C if greenhouse gas emissions continue to rise unabated (RCP8.5). In this scenario, an average summer temperature of between +15.2°C and 17.4°C is possible (compared to 12.6°C today). With consistent climate change mitigation (RCP2.6), the increase in winter temperatures on Napf peak can be moderated, with average winter temperatures of -1.1°C to +0.5°C by 2060 . In summer, temperatures will only rise to around 13.7–15.2°C.
Precipitation
|
Precipitation in winter (mm/month) |
Precipitation in summer (mm/month) |
|||||
|---|---|---|---|---|---|---|---|
Stations |
m a.s.l. |
Situation |
Situation around 2060 |
Situation |
Situation around 2060 |
||
RCP2.6 |
RCP8.5 |
RCP2.6 |
RCP8.5 |
||||
Château-d'Oex |
1028 |
100 |
98 to 122 |
107 to 127 |
138 |
95 to 134 |
80 to 130 |
Lucerne |
454 |
61 |
61 to 75 |
66 to 81 |
151 |
110 to 149 |
95 to 149 |
Napf |
1404 |
101 |
98 to 119 |
105 to 126 |
171 |
130 to 179 |
112 to 166 |
Pilatus |
2106 |
200 |
181 to 226 |
197 to 241 |
164 |
133 to 165 |
116 to 158 |
Säntis |
2502 |
225 |
213 to 265 |
235 to 291 |
248 |
206 to 312 |
193 to 274 |
Legend
At the Lucerne monitoring station, the current average precipitation is 151 mm per month during the summer months. Without any climate change mitigation (RCP8.5), summer precipitation will see a decrease in the period from 2045 to 2074, with average values between 95 mm and 149 mm per month. In the same scenario, winter precipitation is projected to increase from 61 mm to 68–81 mm per month. If comprehensive measures are implemented to reduce greenhouse gas emissions (RCP2.6), the changes in precipitation can be mitigated. In summer, precipitation would then be between 110 mm and 149 mm per month (compared to 151 mm per month today), and in winter, between 61 mm and 75 mm per month (compared to 61 mm per month).
Summer days
Stations |
m a.s.l. |
Summer days now |
Summer days around 2060 |
|
|---|---|---|---|---|
RCP2.6 |
RCP8.5 |
|||
Château-d'Oex |
1028 |
26 |
36 to 50 |
50 to 79 |
Lucerne |
454 |
44 |
53 to 67 |
69 to 92 |
Napf |
1404 |
2 |
4 to 11 |
8 to 24 |
Pilatus |
2106 |
0 |
0 |
0 to 3 |
Säntis |
2502 |
0 |
0 |
0 |
Legend
Currently, the monitoring station of Château-d'Oex has an average of 26 summer days (temperature of at least 25°C) per year. Without climate change mitigation (RCP8.5), there could be up to 79 summer days per year in Château-d'Oex by the middle of this century (2060). With consistent implementation of climate change mitigation (RCP2.6), the increase would be less pronounced, up to 50 summer days.
Tropical nights
Stations |
m a.s.l. |
Tropical nights now |
Tropical nights around 2060 |
|
|---|---|---|---|---|
RCP2.6 |
RCP8.5 |
|||
Château-d'Oex |
1028 |
0.0 |
0.0 to 0.2 |
0.1 to 1.7 |
Lucerne |
454 |
0.1 |
0.6 to 3.5 |
3.3 to 11.3 |
Napf |
1404 |
0.4 |
0.3 to 2.1 |
1.7 to 8.0 |
Pilatus |
2106 |
0.0 |
0.0 to 0.1 |
0.0 to 0.7 |
Säntis |
2502 |
0.0 |
0.0 to 0.0 |
0.0 to 0.0 |
Legend
Tropical nights were rare at the monitoring location in Lucerne during the normal period of 1981–2010: An average number of 0.1 tropical nights per year were observed. Without climate change mitigation (RCP8.5), there could be up to 11.3 tropical nights per year at this station by the middle of this century (2060). With consistent climate change mitigation (RCP2.6), the average number of tropical nights would be limited to up to 3.5 per year.
Frost days
Stations |
m a.s.l. |
Frost days now |
Frost days around 2060 |
|
|---|---|---|---|---|
RCP2.6 |
RCP8.5 |
|||
Château-d'Oex |
1028 |
129 |
100 to 125 |
82 to 101 |
Lucerne |
454 |
82 |
57 to 74 |
44 to 61 |
Napf |
1404 |
133 |
100 to 124 |
85 to 104 |
Pilatus |
2106 |
193 |
155 to 179 |
134 to 155 |
Säntis |
2502 |
244 |
205 to 231 |
181 to 204 |
Legend
The monitoring station of Pilatus has an average of 193 frost days (minimum temperature below 0°C) per year. Without climate change mitigation (RCP8.5), the number of frost days on Pilatus is projected to decrease to 134–155 per year by the middle of this century (2060). With consistent climate change mitigation, there will be a smaller reduction in the number of frost days per year, to 155–179.
Days with fresh snowfall
Stations |
m a.s.l. |
Days with fresh snowfall now |
Days with fresh snowfall around 2060 |
|
|---|---|---|---|---|
RCP2.6 |
RCP8.5 |
|||
Château-d'Oex |
1028 |
33 |
23 to 38 |
17 to 31 |
Lucerne |
454 |
13 |
9 to 19 |
6 to 13 |
Napf |
1404 |
56 |
33 to 49 |
27 to 39 |
Pilatus |
2106 |
96 |
66 to 85 |
59 to 74 |
Säntis |
2502 |
117 |
97 to 117 |
86 to 103 |
Legend
At the Säntis monitoring station, an average of 117 days with fresh snowfall (minimum of 1 mm of precipitation falling in the form of snow) per year were recorded during the normal period of 1981–2010. Without climate change mitigation (RCP8.5), the number of days with fresh snowfall per year will decrease to 86–103 at the Säntis station by the middle of the century (2060). With consistent climate change mitigation (RCP2.6), there will be a smaller reduction in the number of days of fresh snowfall days per year, to 97–117.
Charts
The interactive charts for all indicators use Lucerne as an example. You can find the figures for other stations in the CH2018 web Atlas.
Luzern
What do RCP2.6 and RCP8.5 mean? You can find an explanation of the emission scenarios here.
Last modification 26.06.2024